 DevTools
The live workbench for Visual FoxPro.
DevTools attaches to your running VFP 9 app with no changes to your code, then lets you work from your browser: build and hot-reload plugins, run code and SQL against the live app, and watch what it is actually doing. The developer loop Visual FoxPro never had.
runs on your machine · attaches with zero app-code changes · Windows + any browser
Build plugins live
Develop FLLs and COM DLLs and hot-swap them into a running VFP as you build, no restart.
Drive from a browser
A live FoxPro console: run code and SQL against the running app, toggle features.
See into your code
Browse tables, watch expressions live, and see errors folded into distinct issues.
Zero app-code changes
Attach with nothing added to your application, and nothing to remember to remove.
Product tour
Watch a live FoxPro app.
A few moments from a running demo app: launch and attach, drive it from a console, hot-reload your code, query its data, and watch it run, all from the browser, with nothing added to the app.
One click, VFP starts up, tooling attached.
Hit Launch and DevTools starts Visual FoxPro with the tooling already wired in. It connects back and shows up in your dashboard in seconds, nothing added to your app.
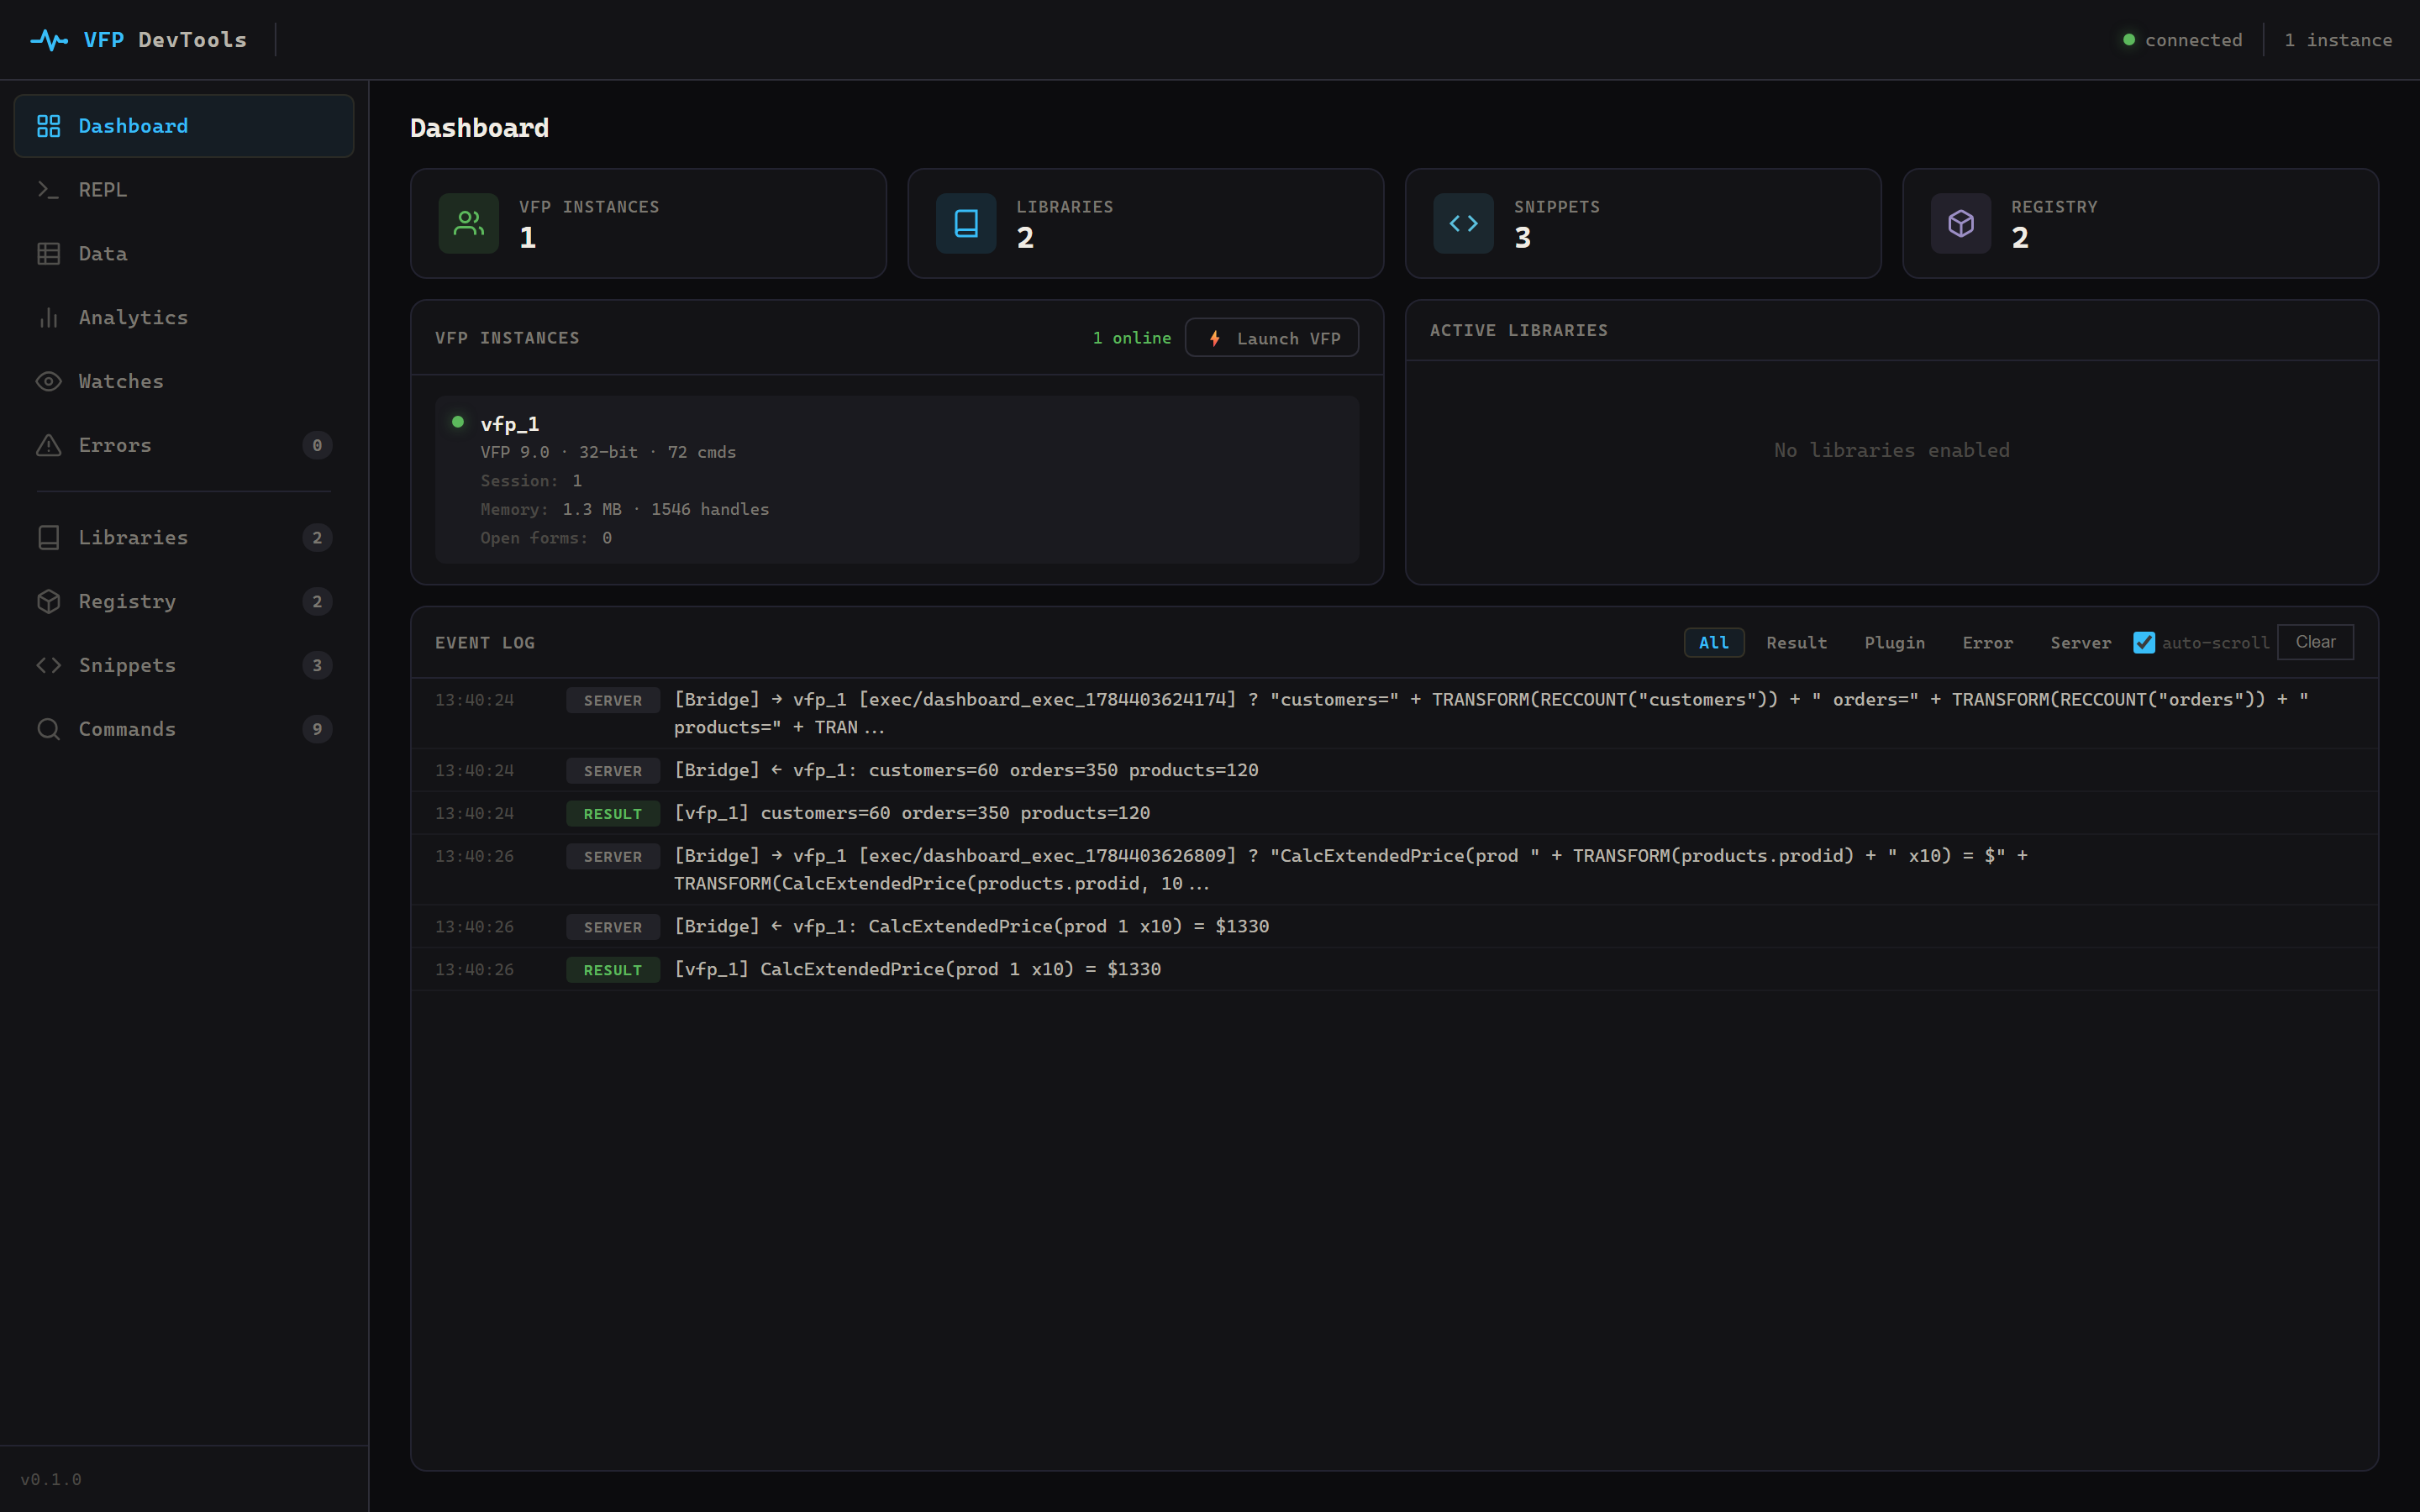
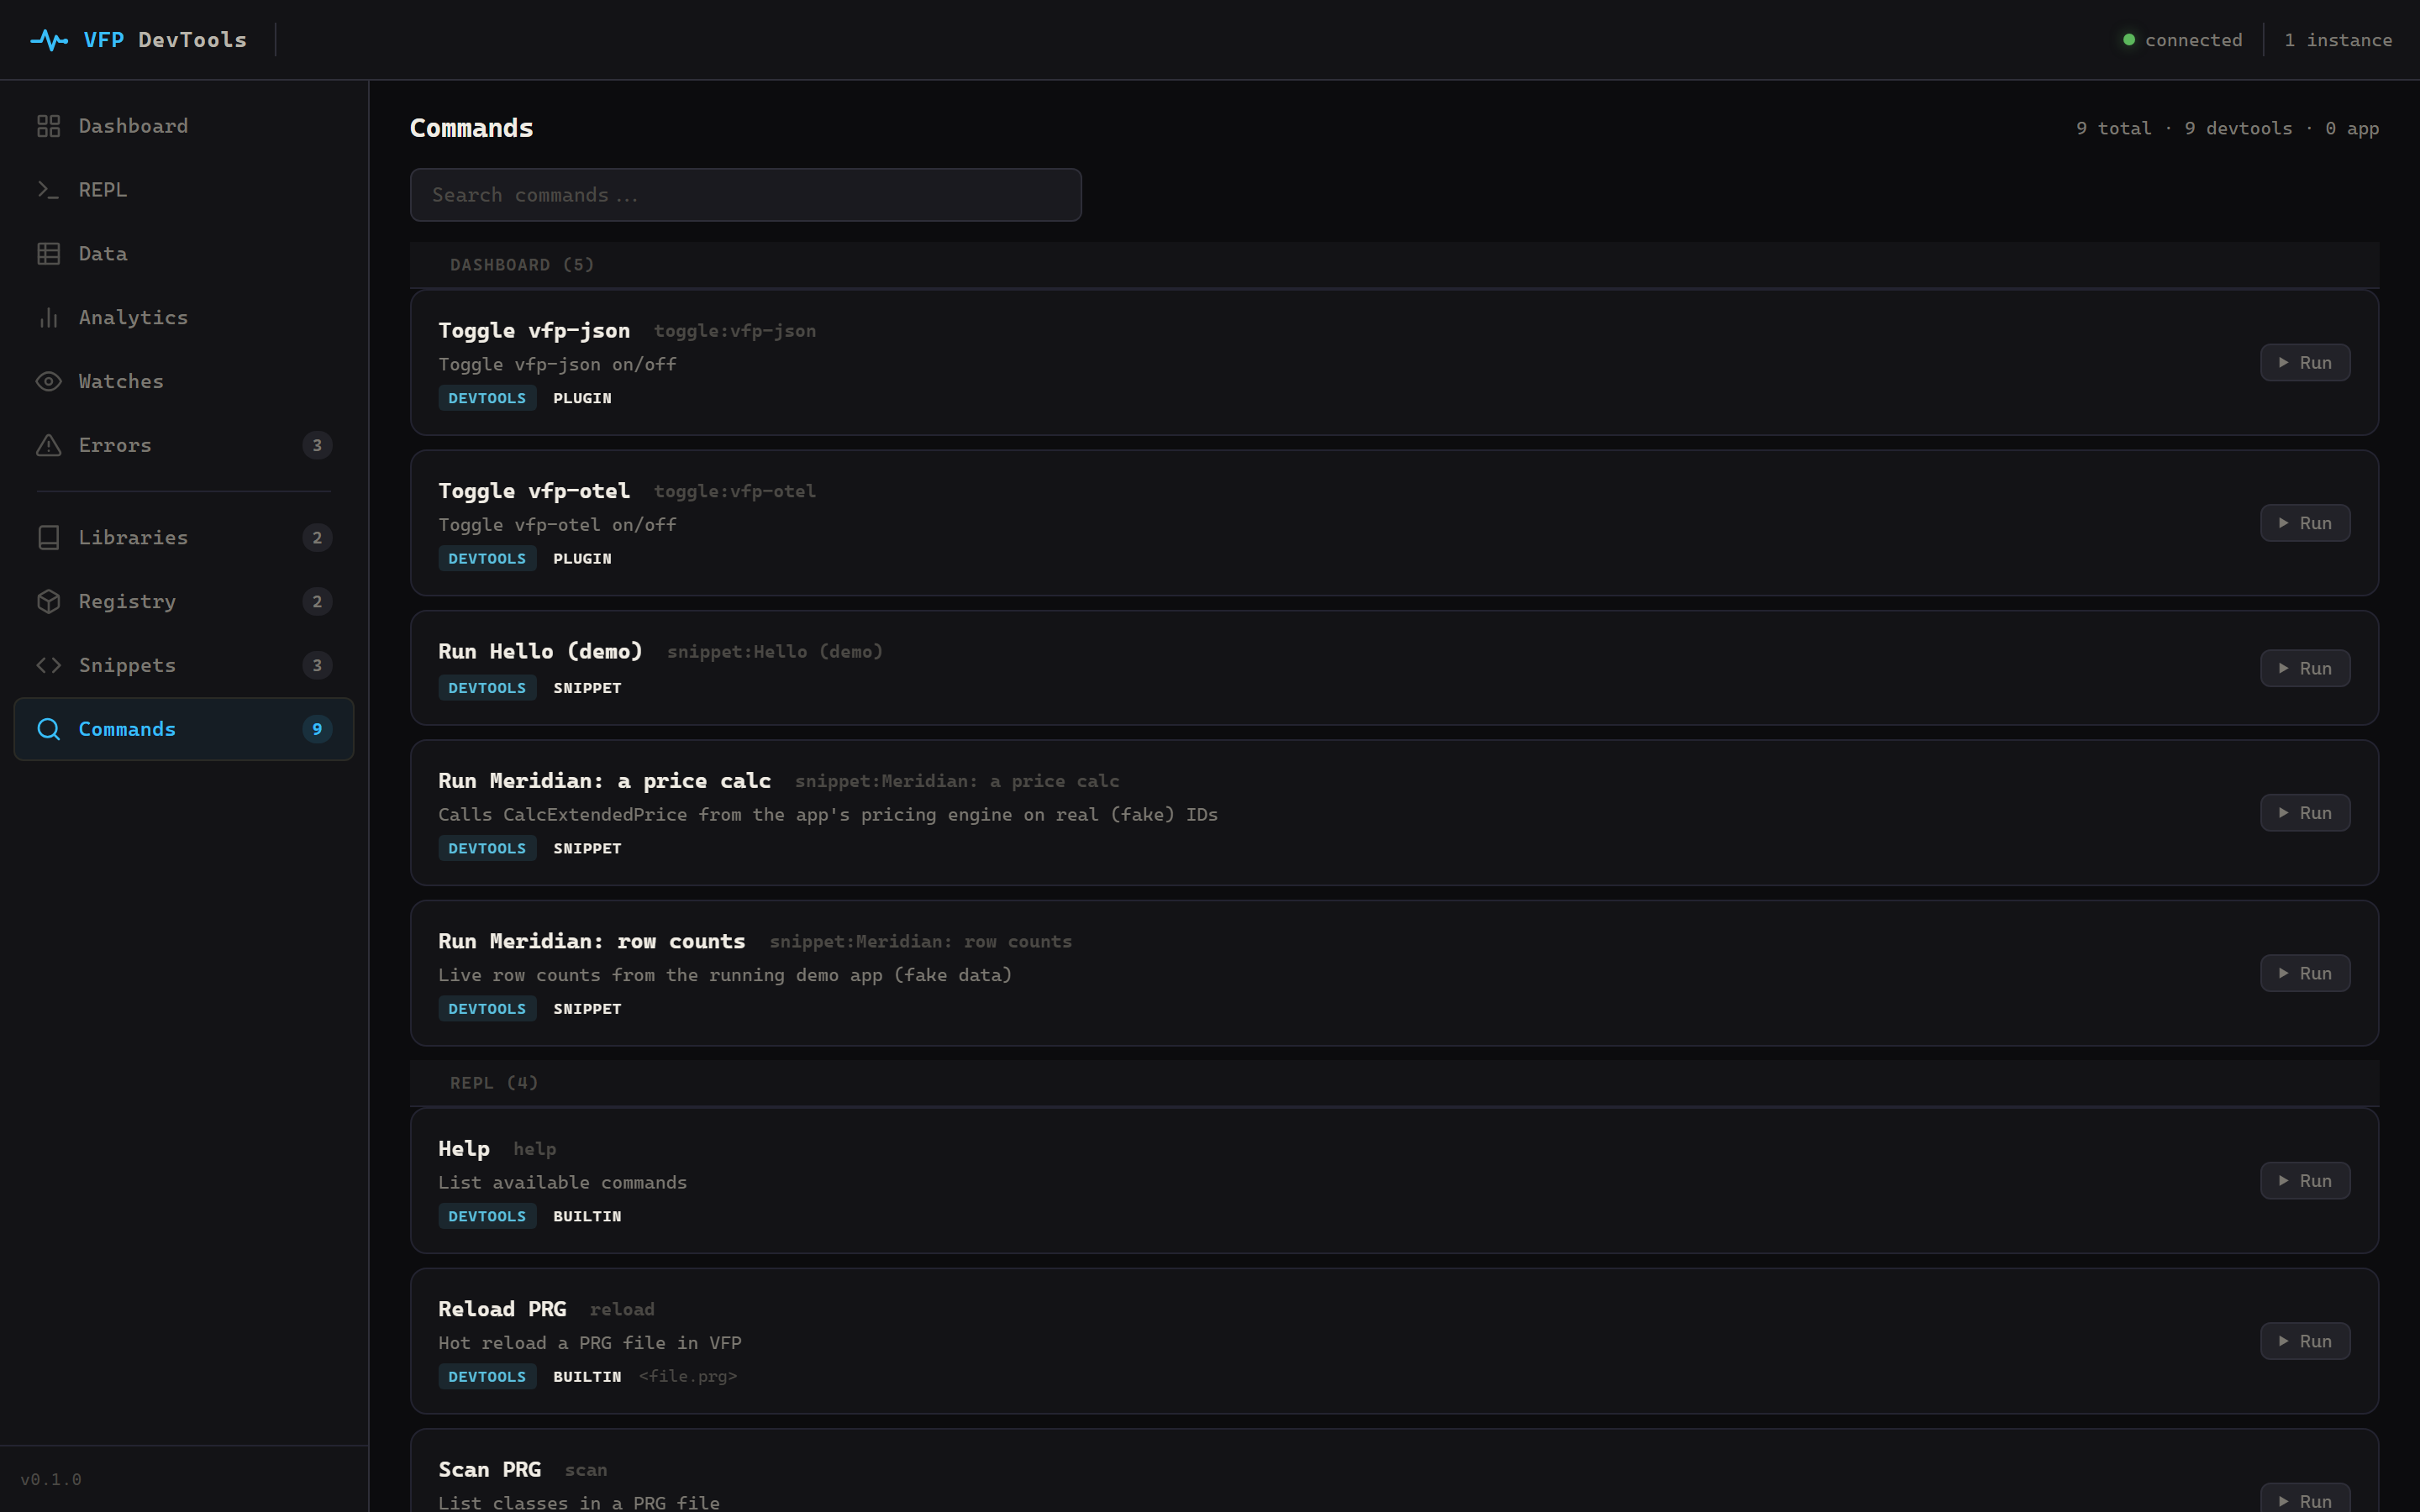
A FoxPro console, in your browser.
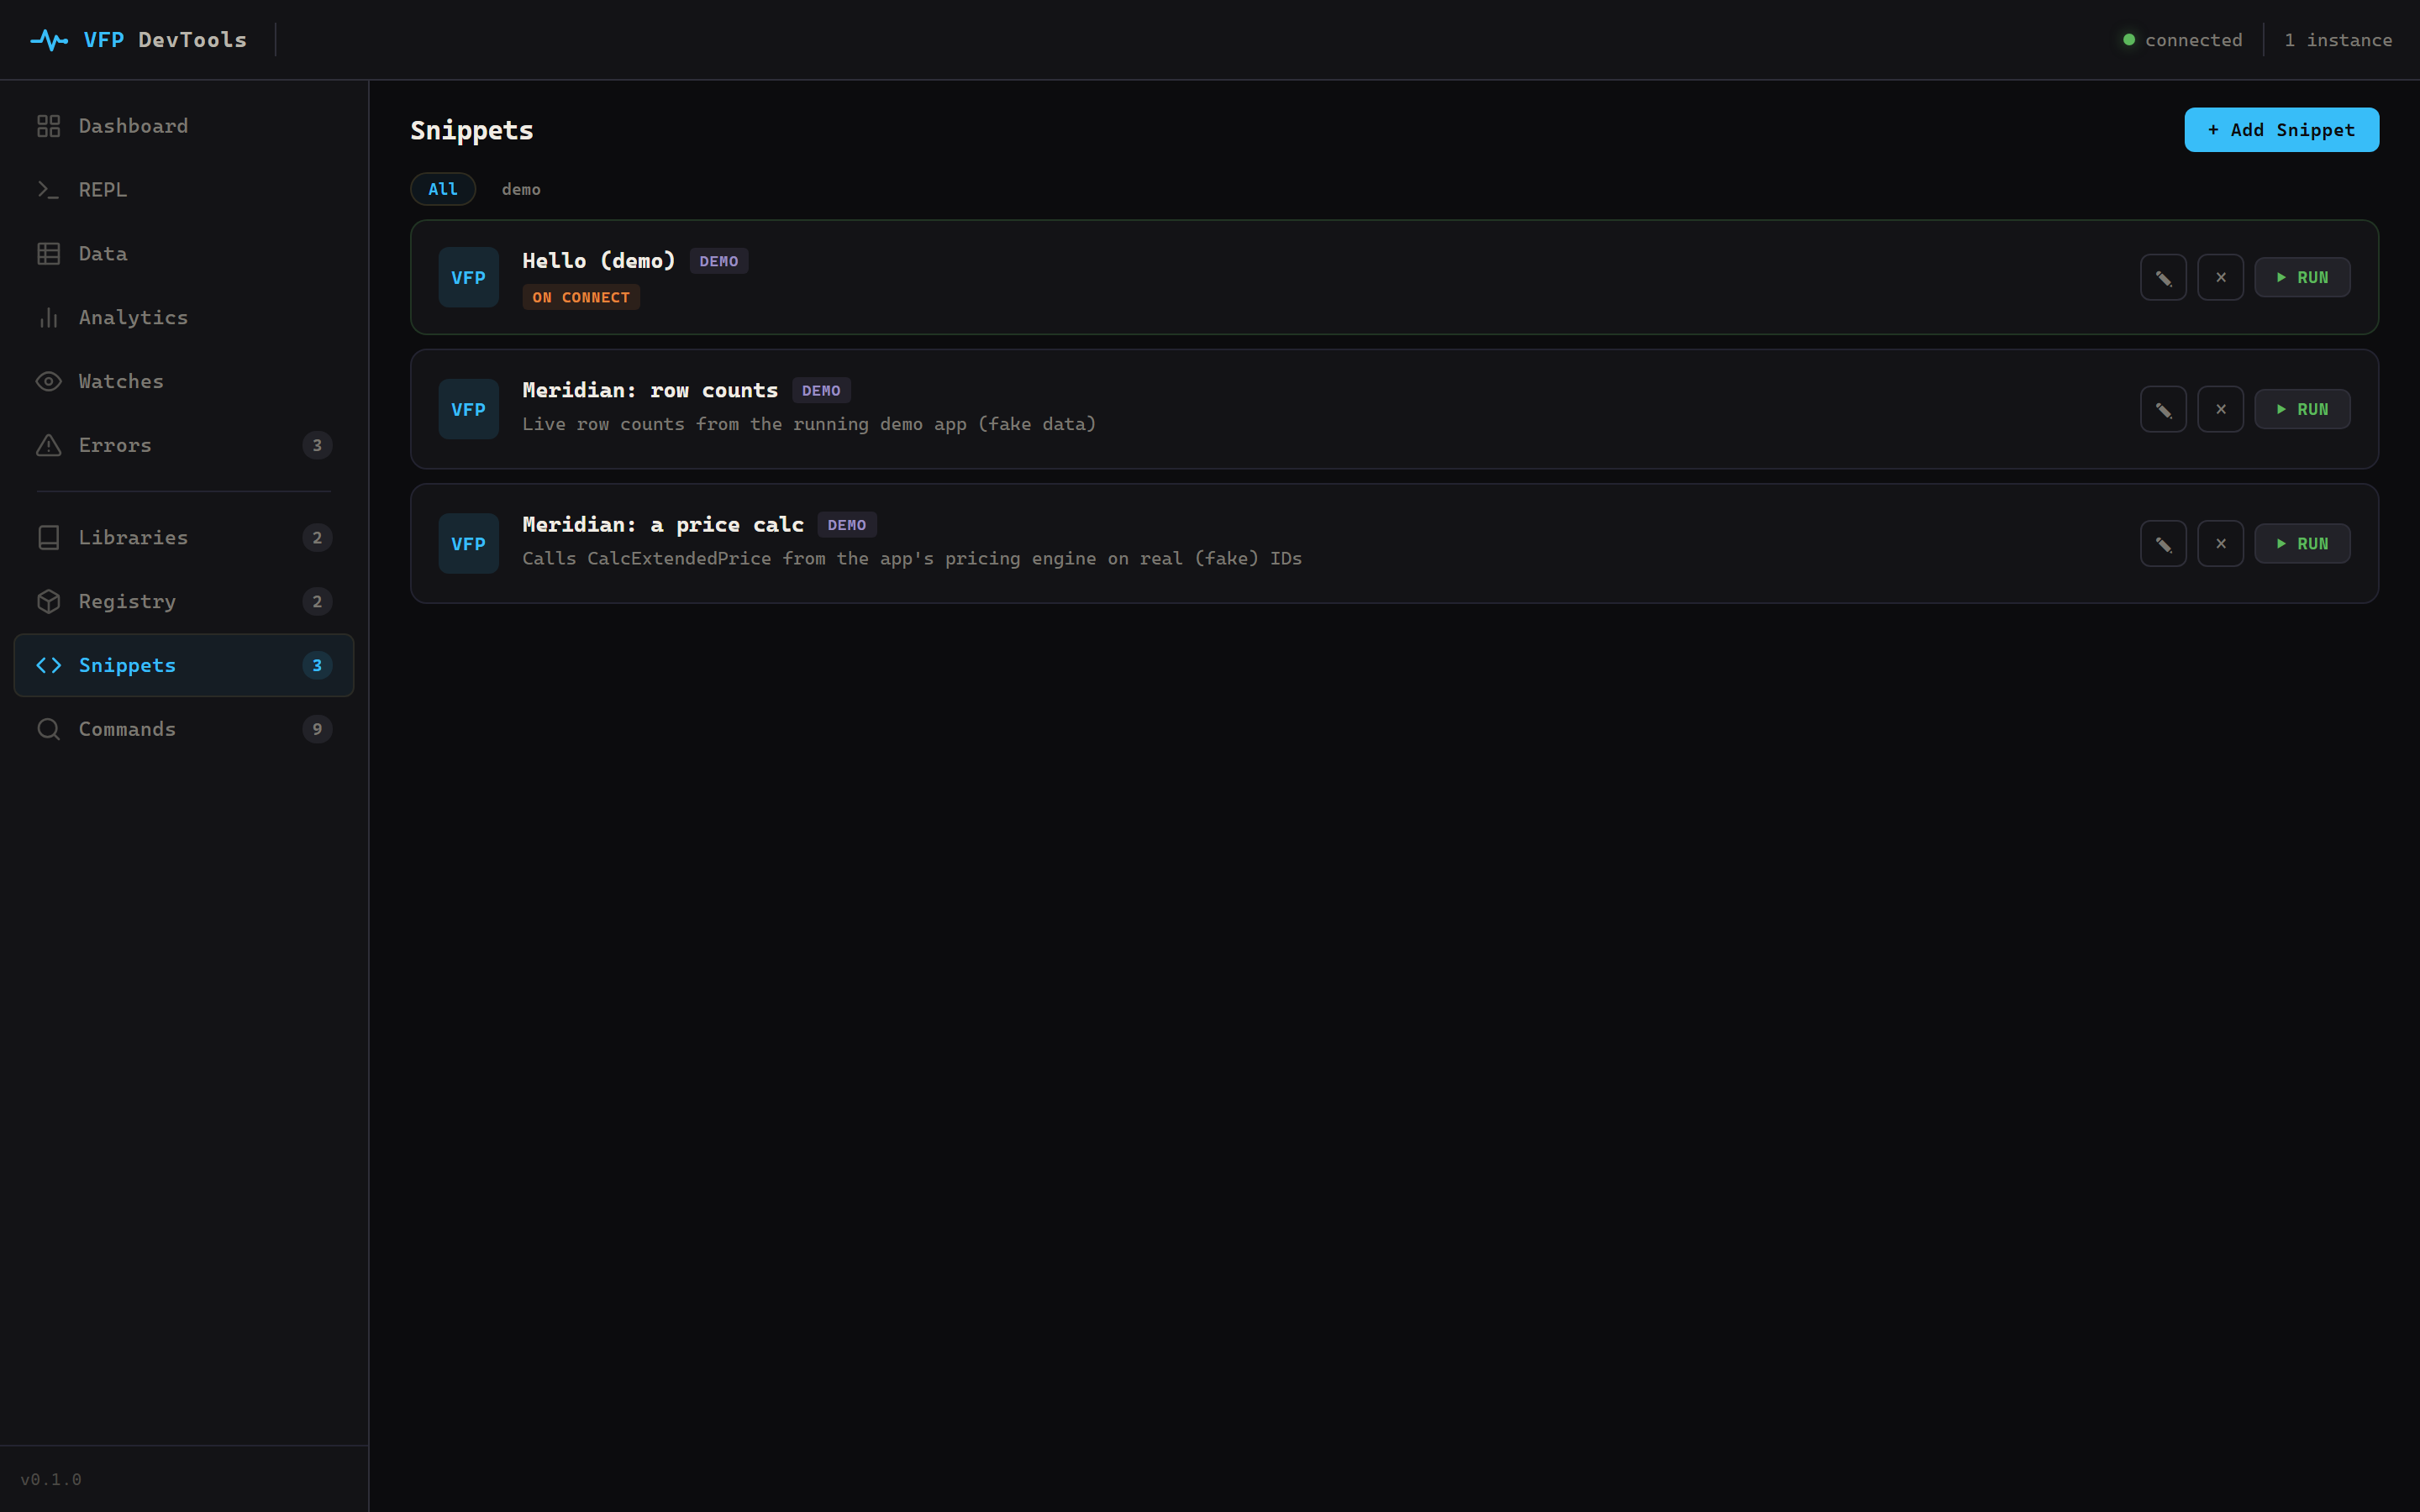
Type FoxPro, run it against the live app, and the result comes straight back. Toggle features and run saved snippets without touching the app or leaving the page.
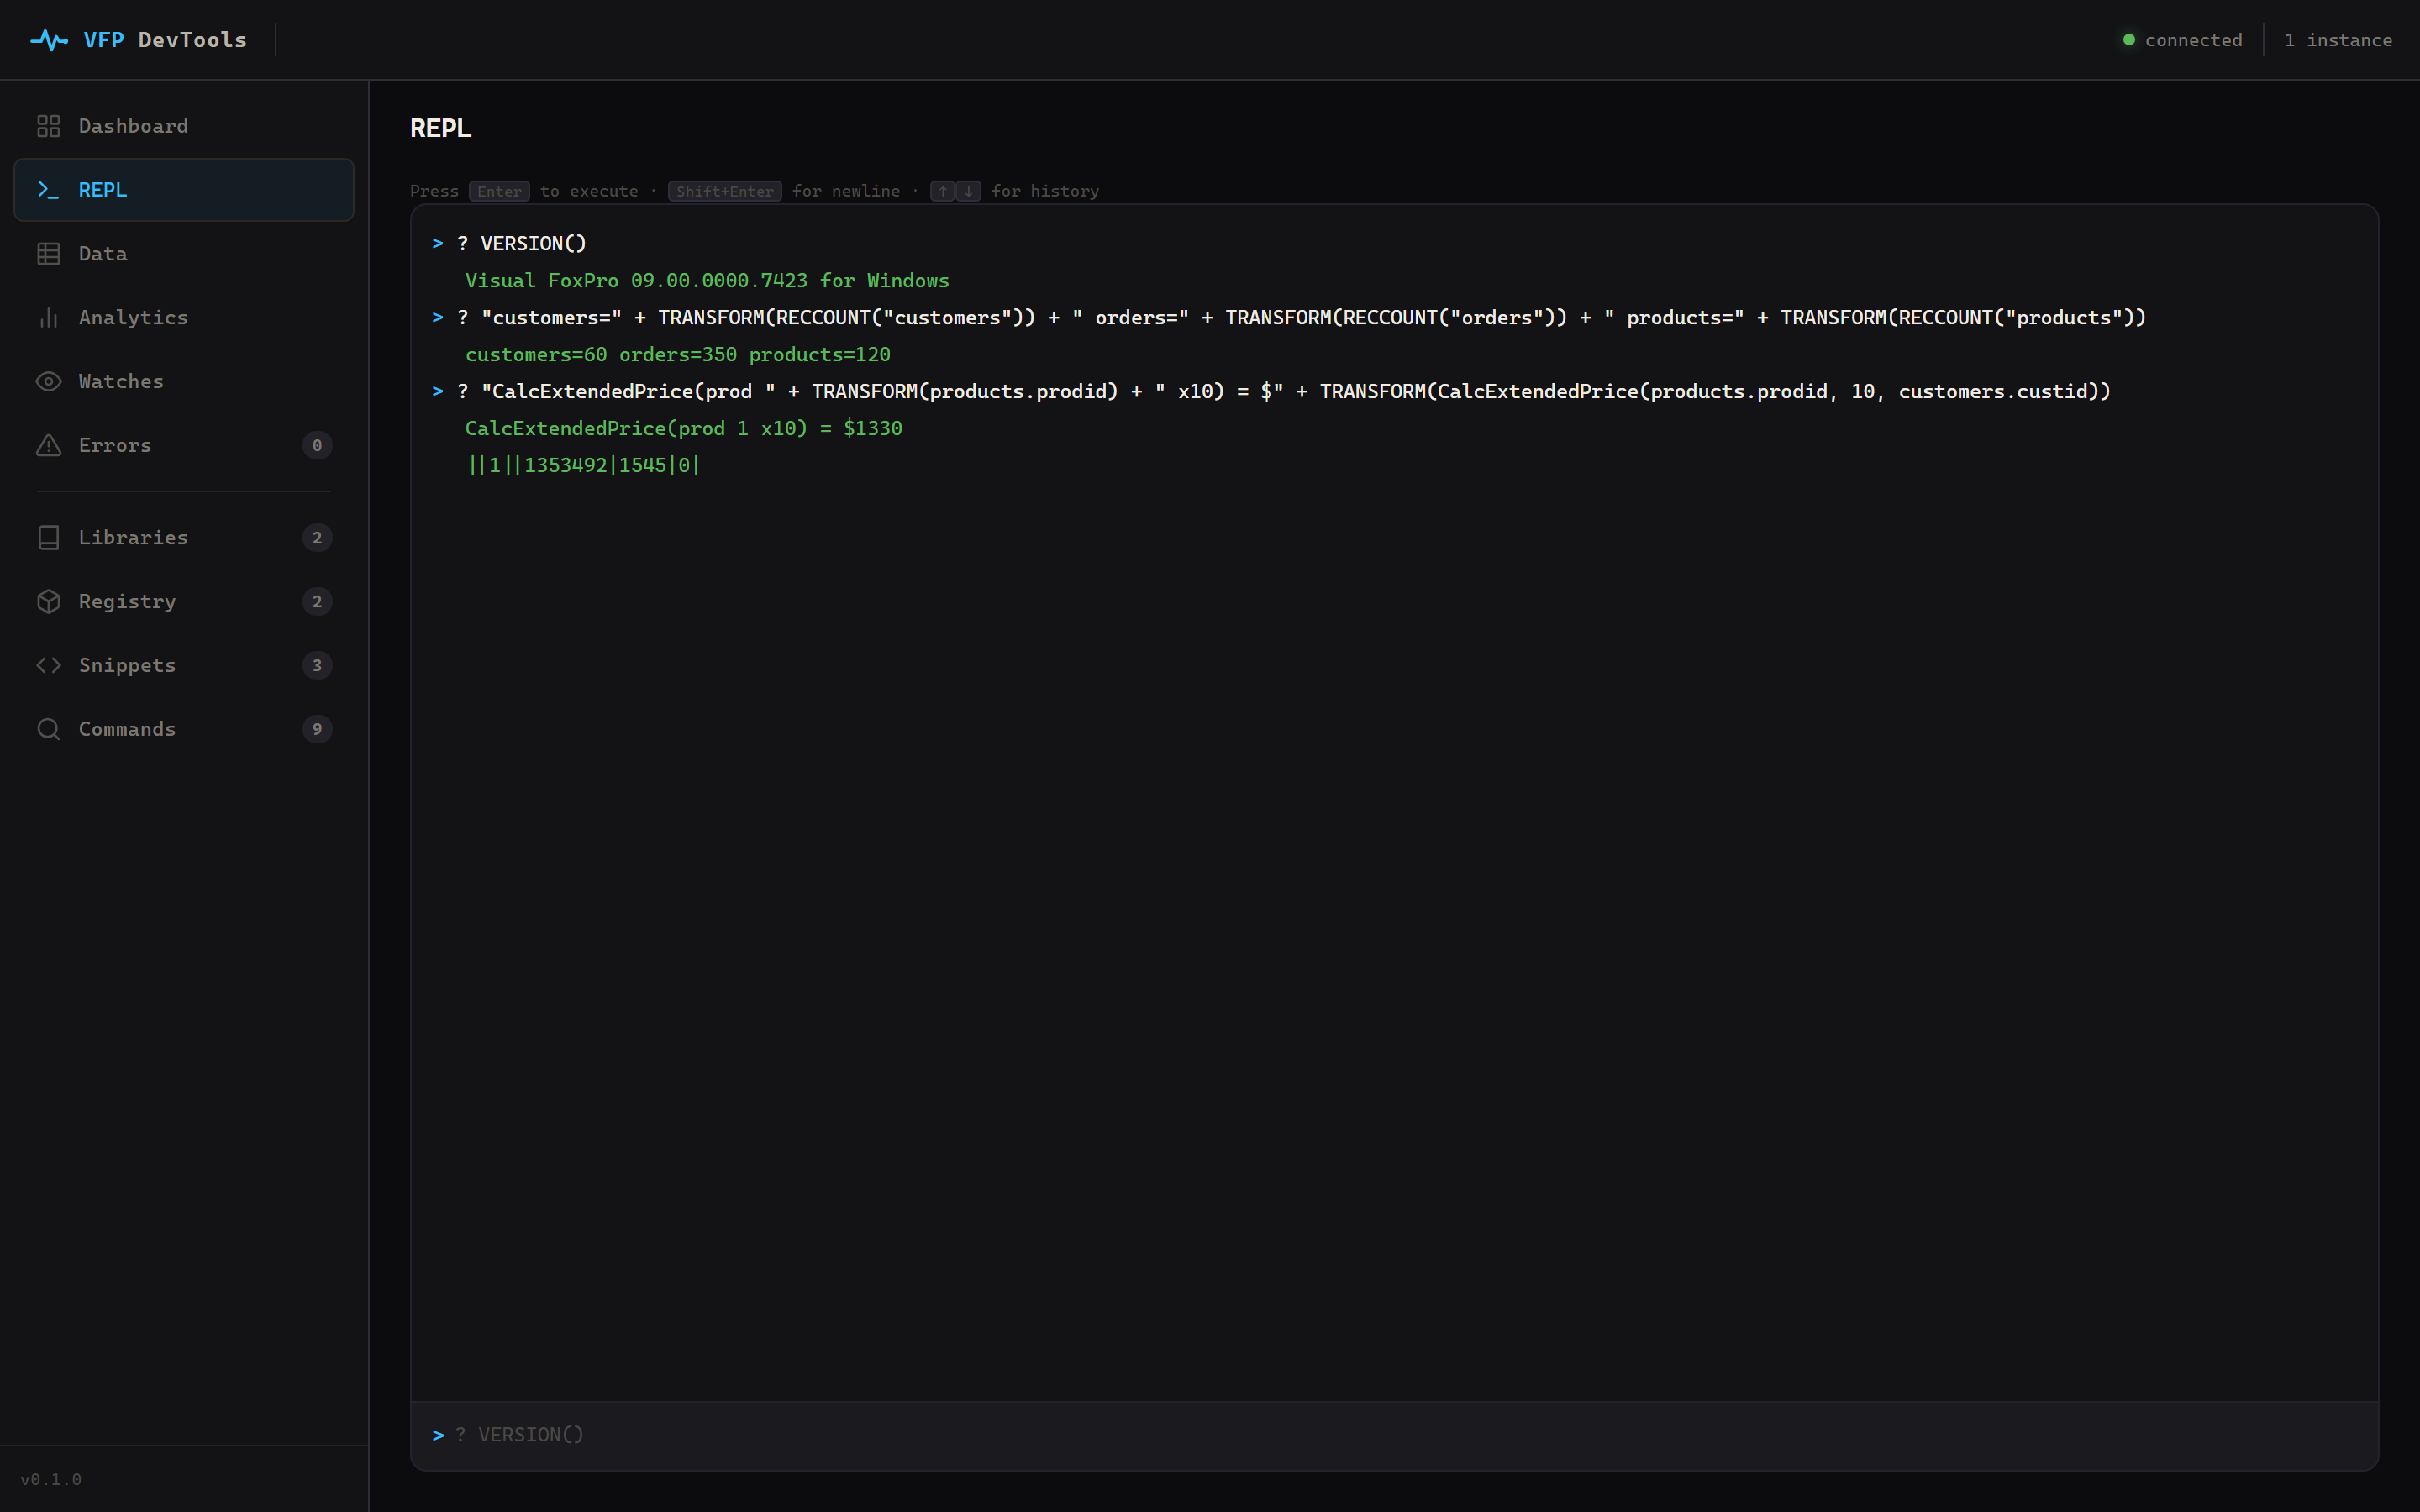
Save. It's already reloaded.
Edit a class or program and it reloads in the running app instantly. And the part most tools cannot do: rebuild a compiled FLL or COM DLL and DevTools hot-swaps it into the live VFP, no restart, no clicking back to where you were. The tightest FoxPro edit loop there is, and the one plugin and library development always needed.
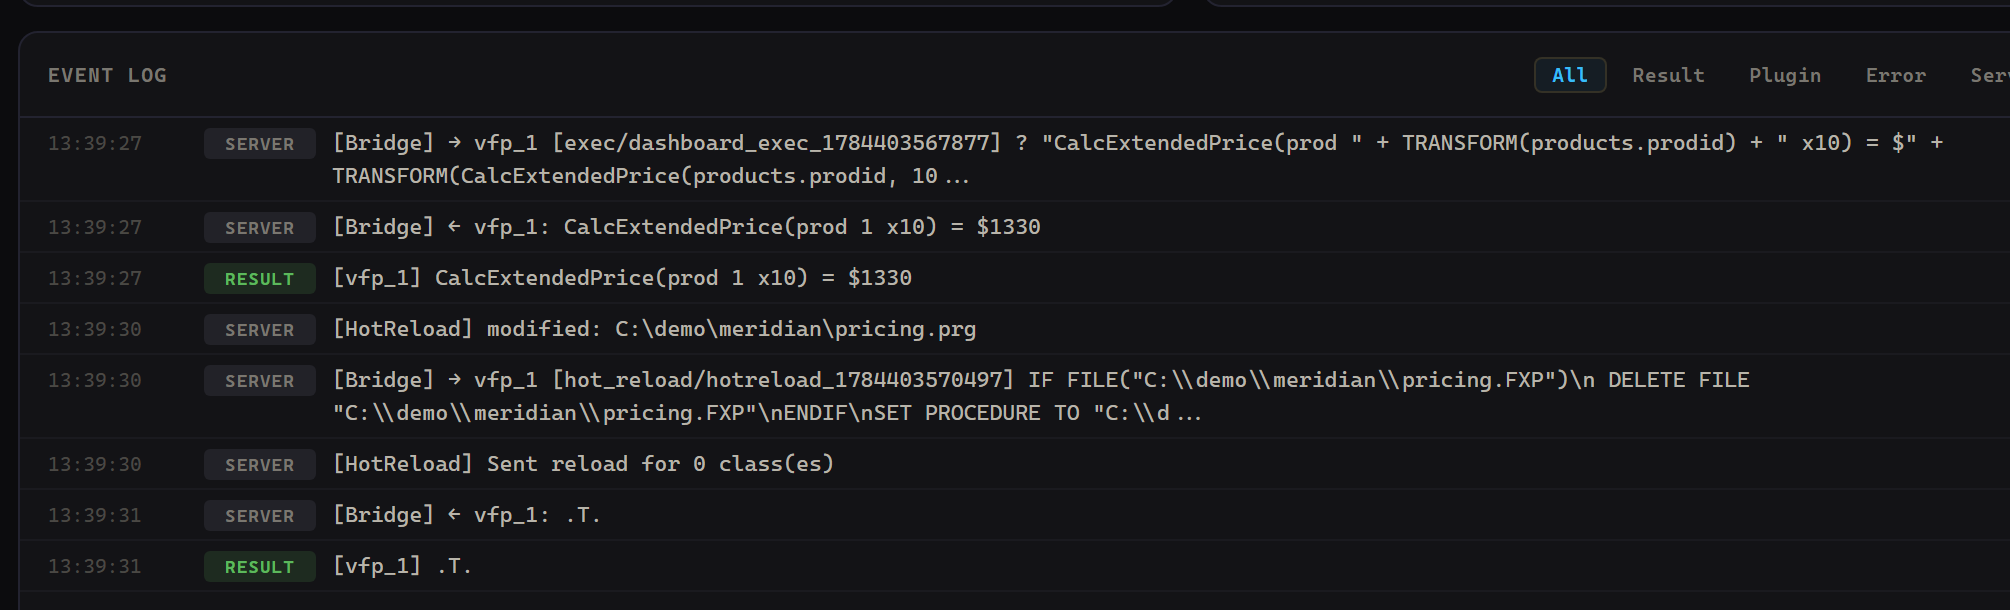
Browse and query your data, live.
Browse any VFP table from the browser as a typed grid, with no VFP running, or run a SQL SELECT against the running app for the queries a static tool cannot answer, the ones that call your own functions against the real, live data.
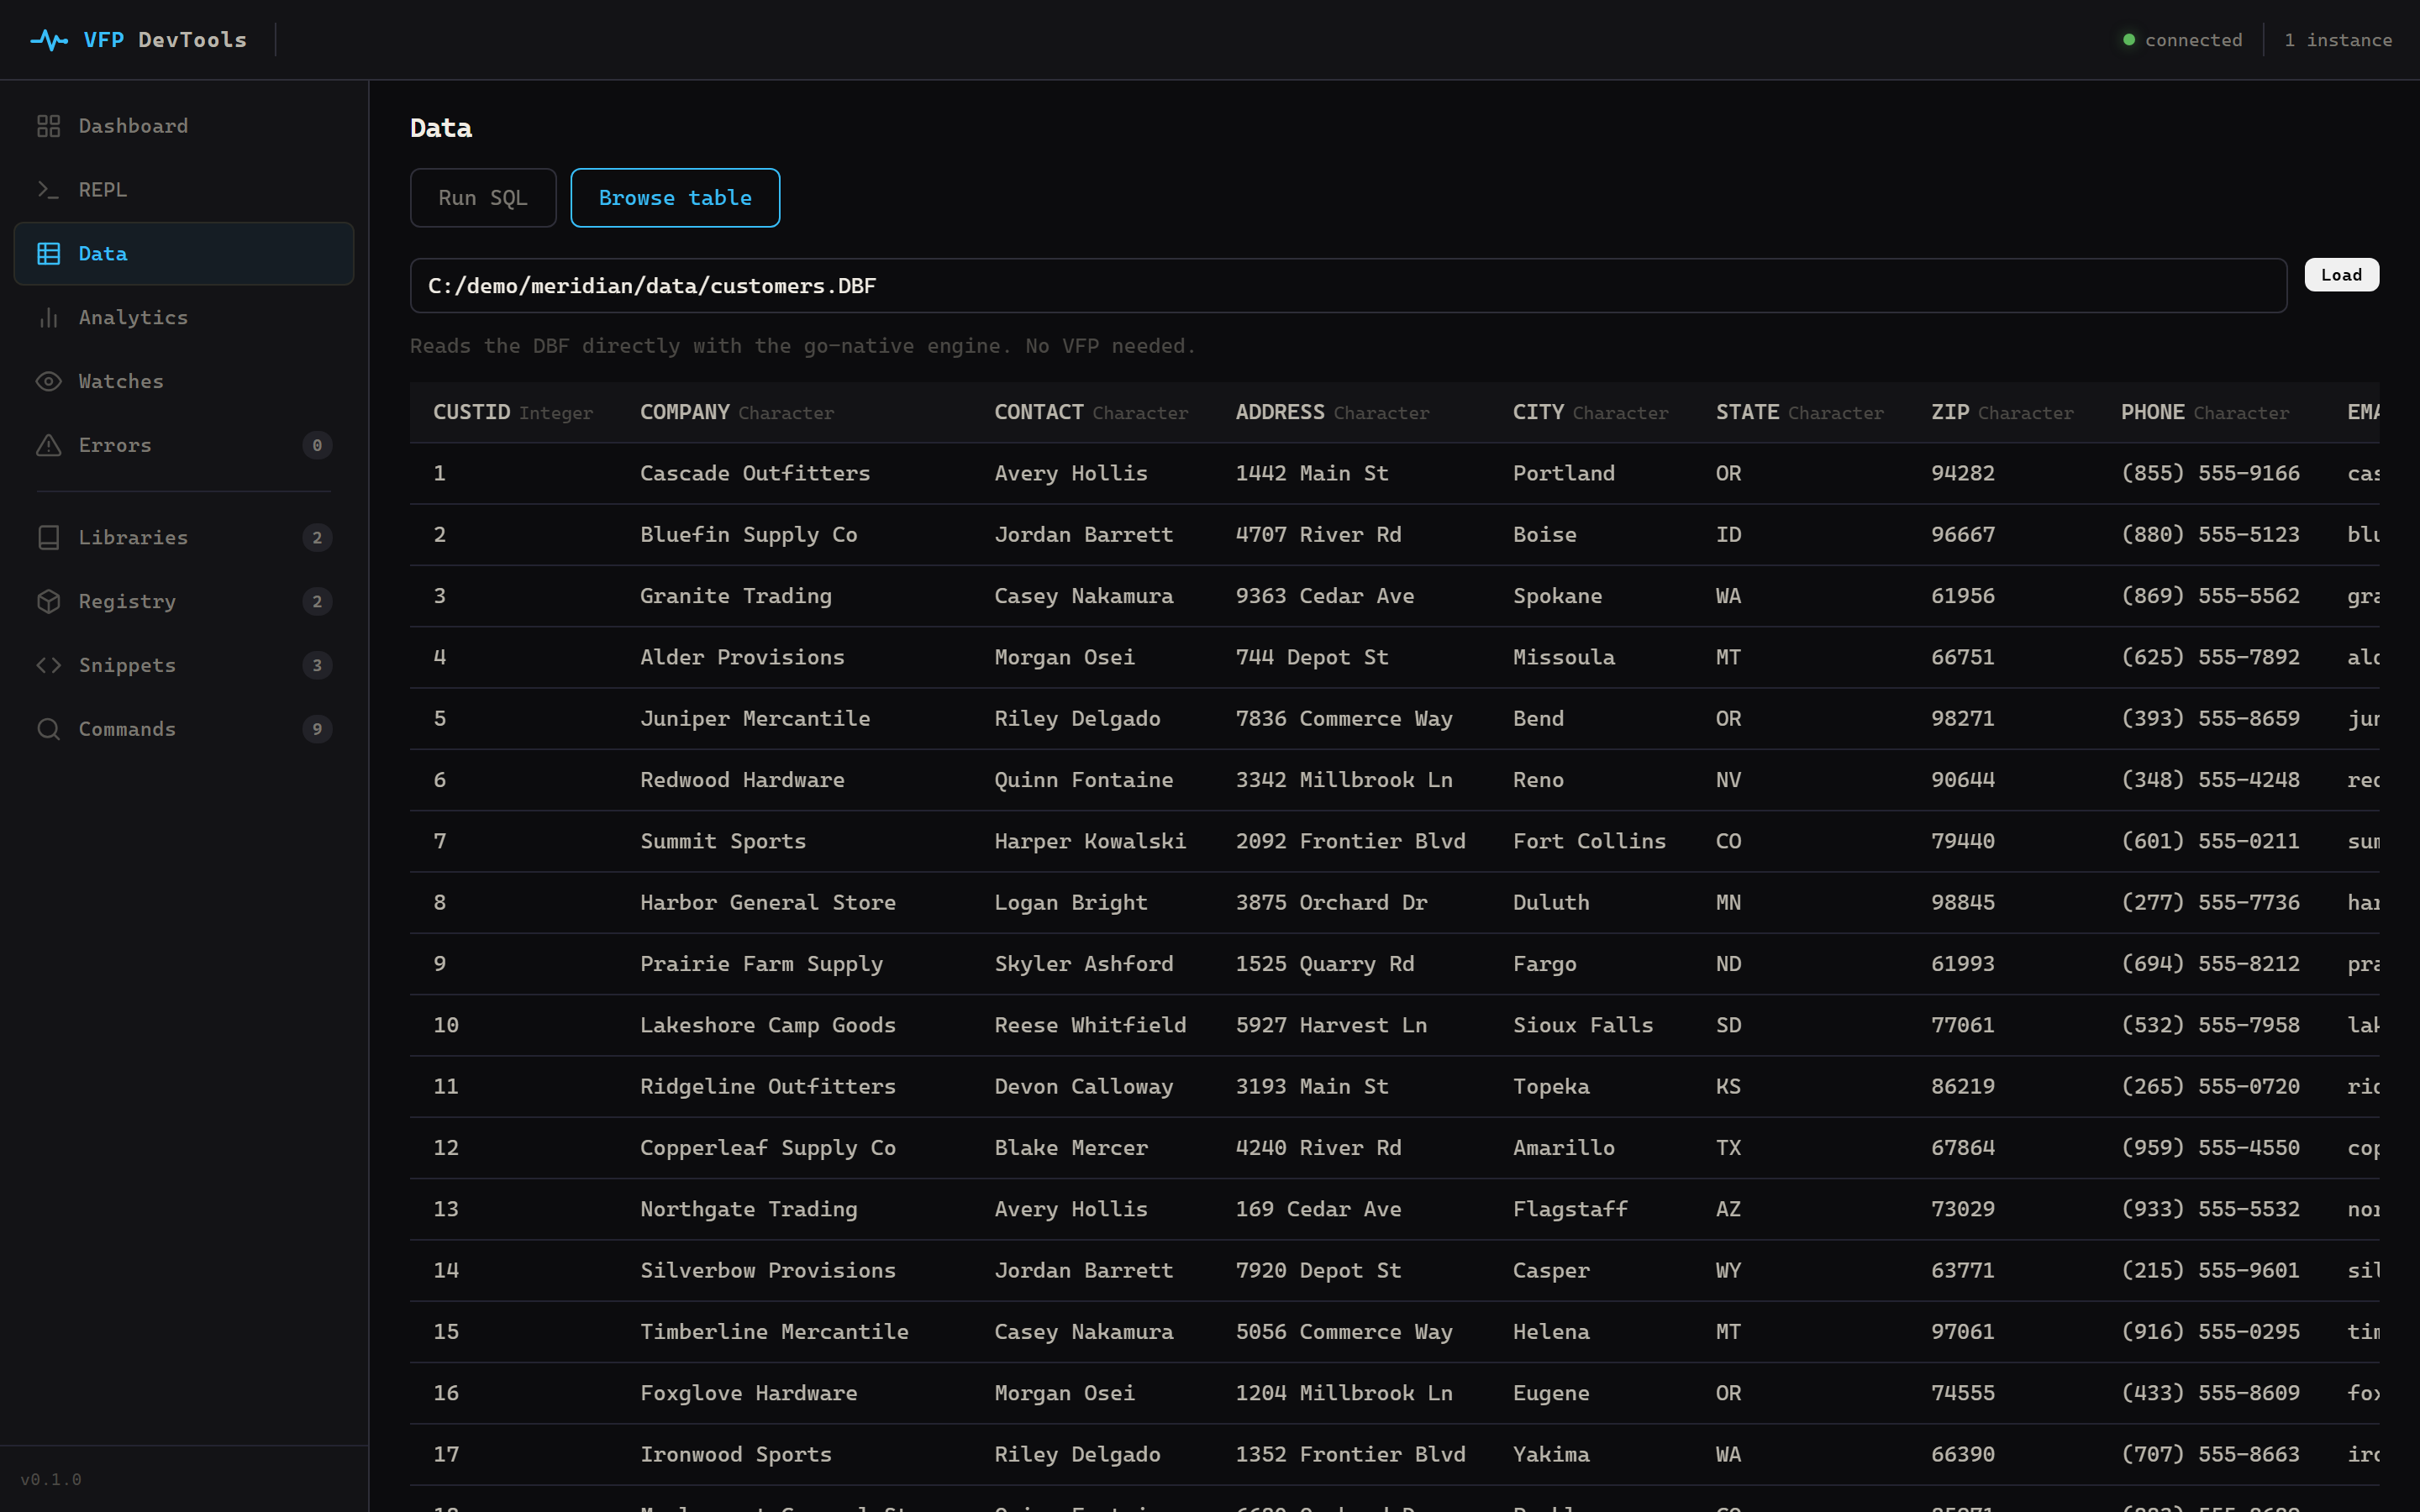
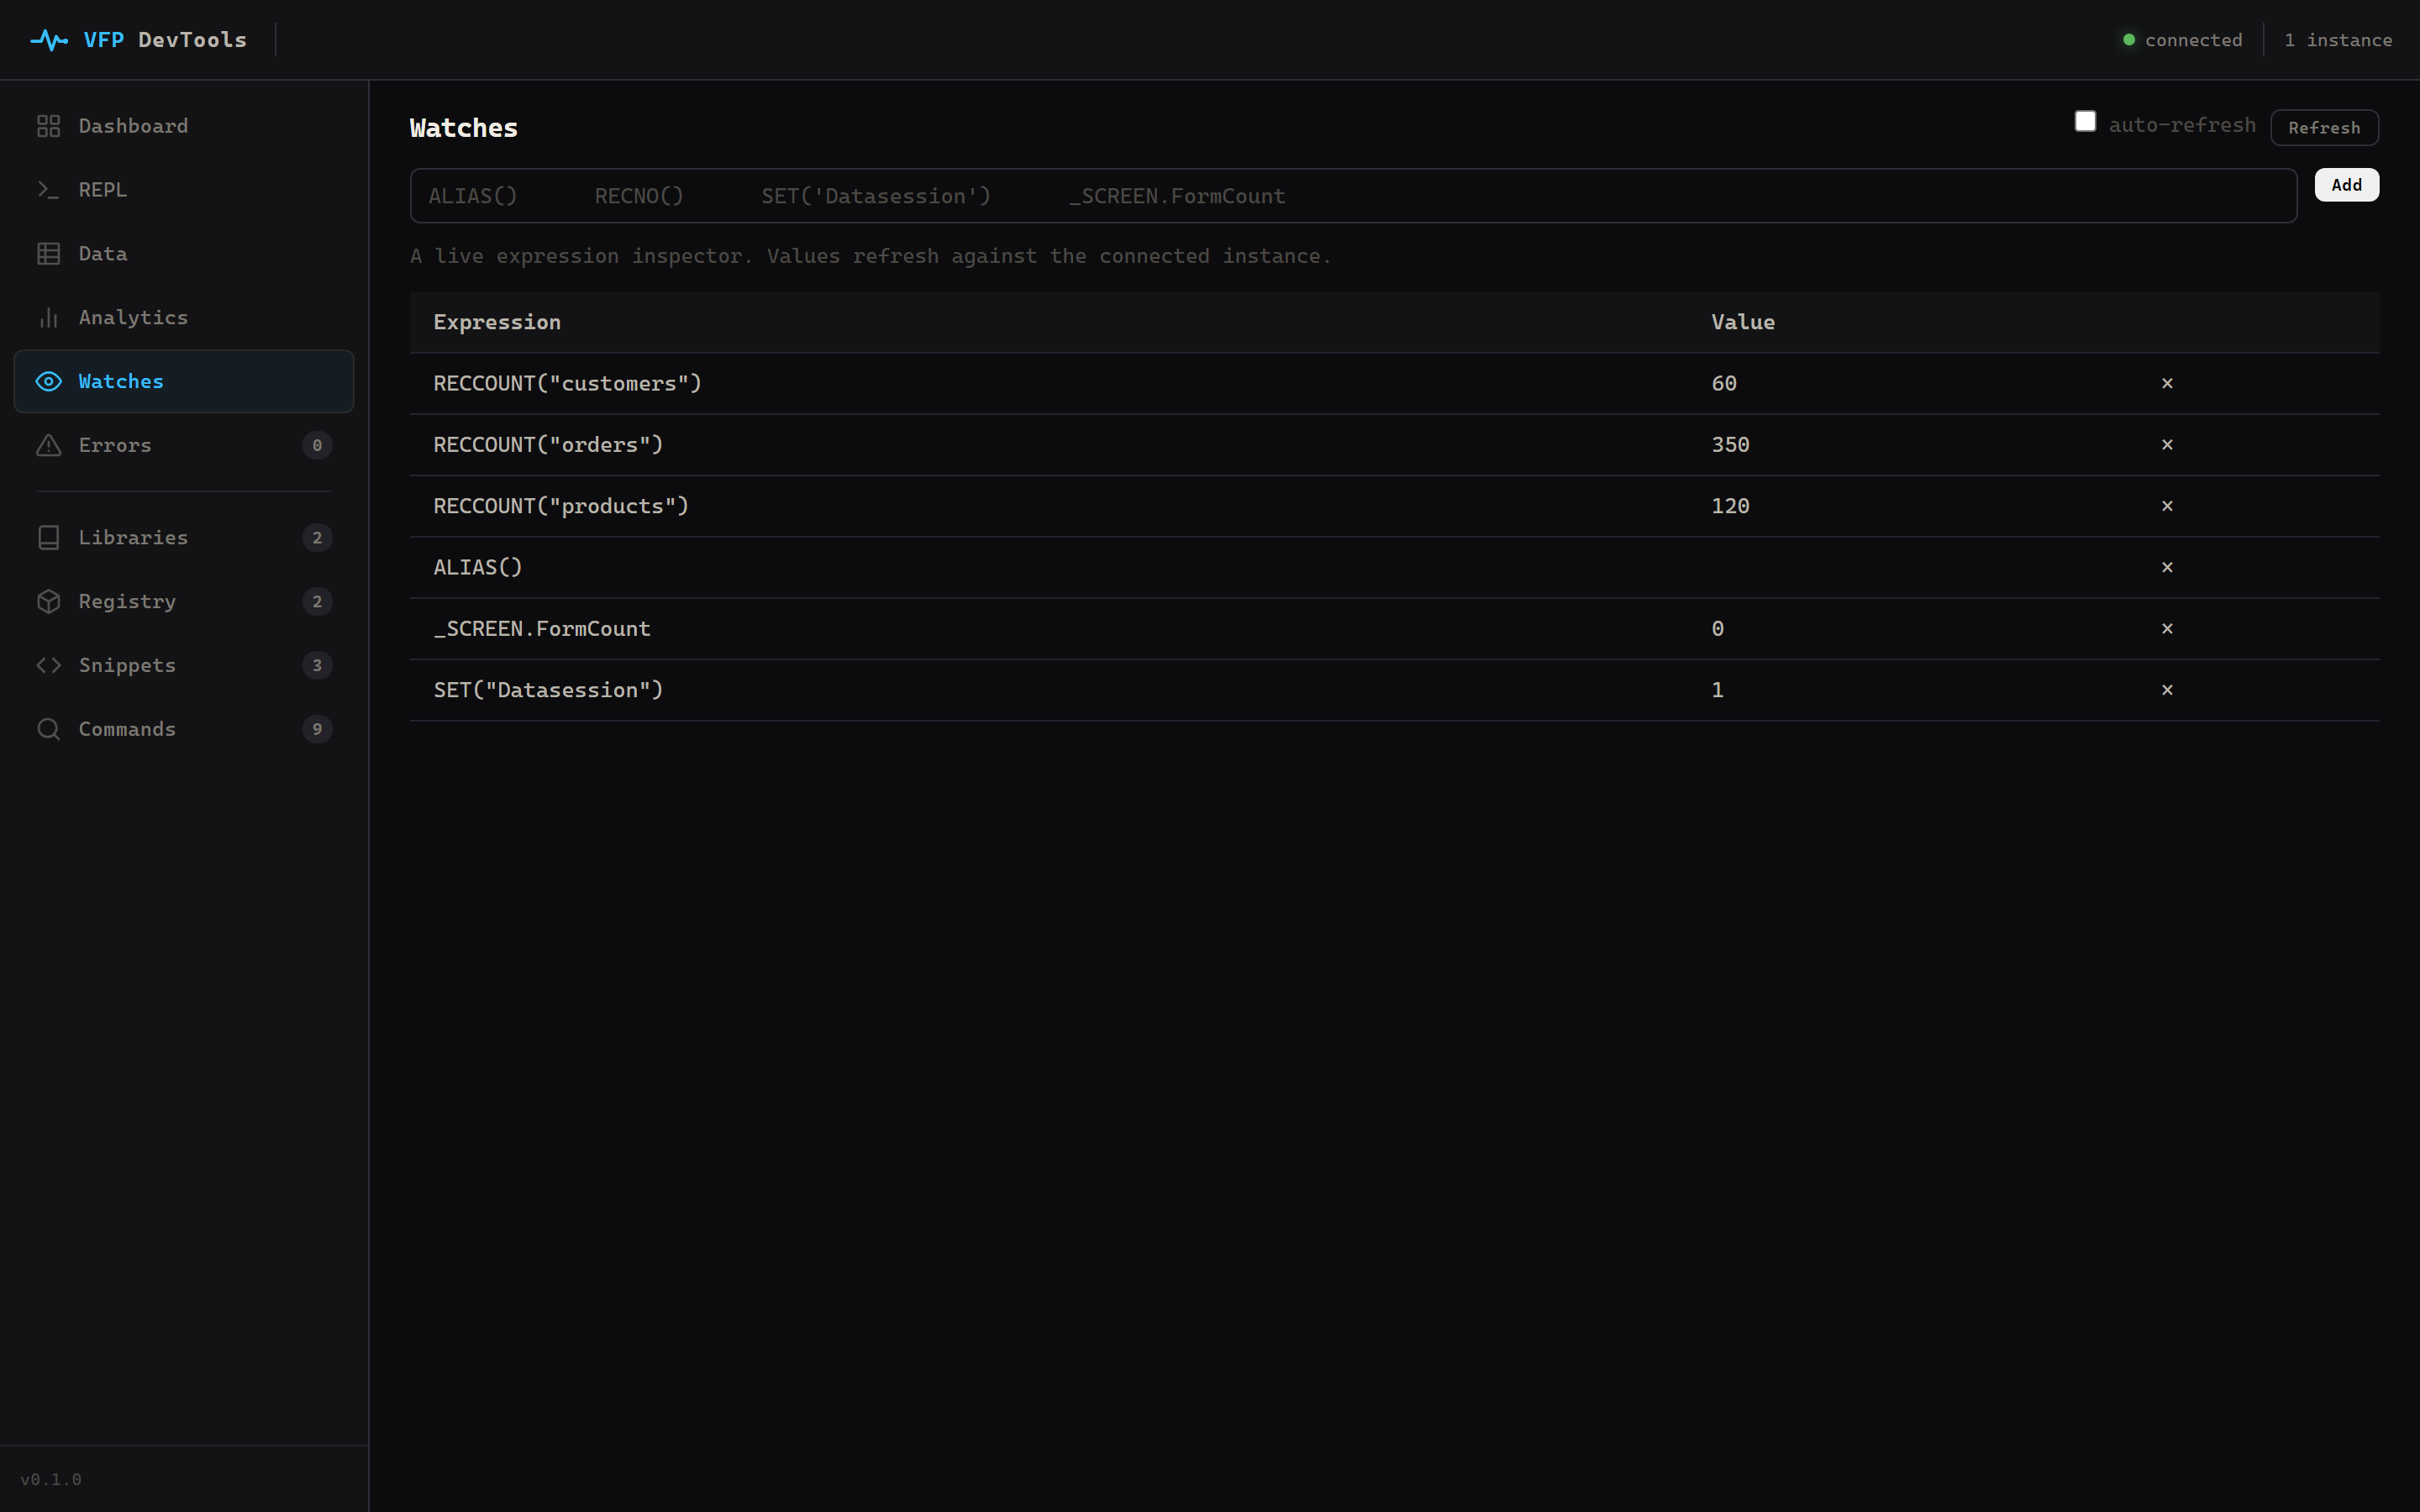
Watch its state, as it runs.
Add VFP expressions, record counts, open cursors, form counts, a variable, and watch their values update live against the running app. A debugger watch window in your browser, the thing a static map can never show you.
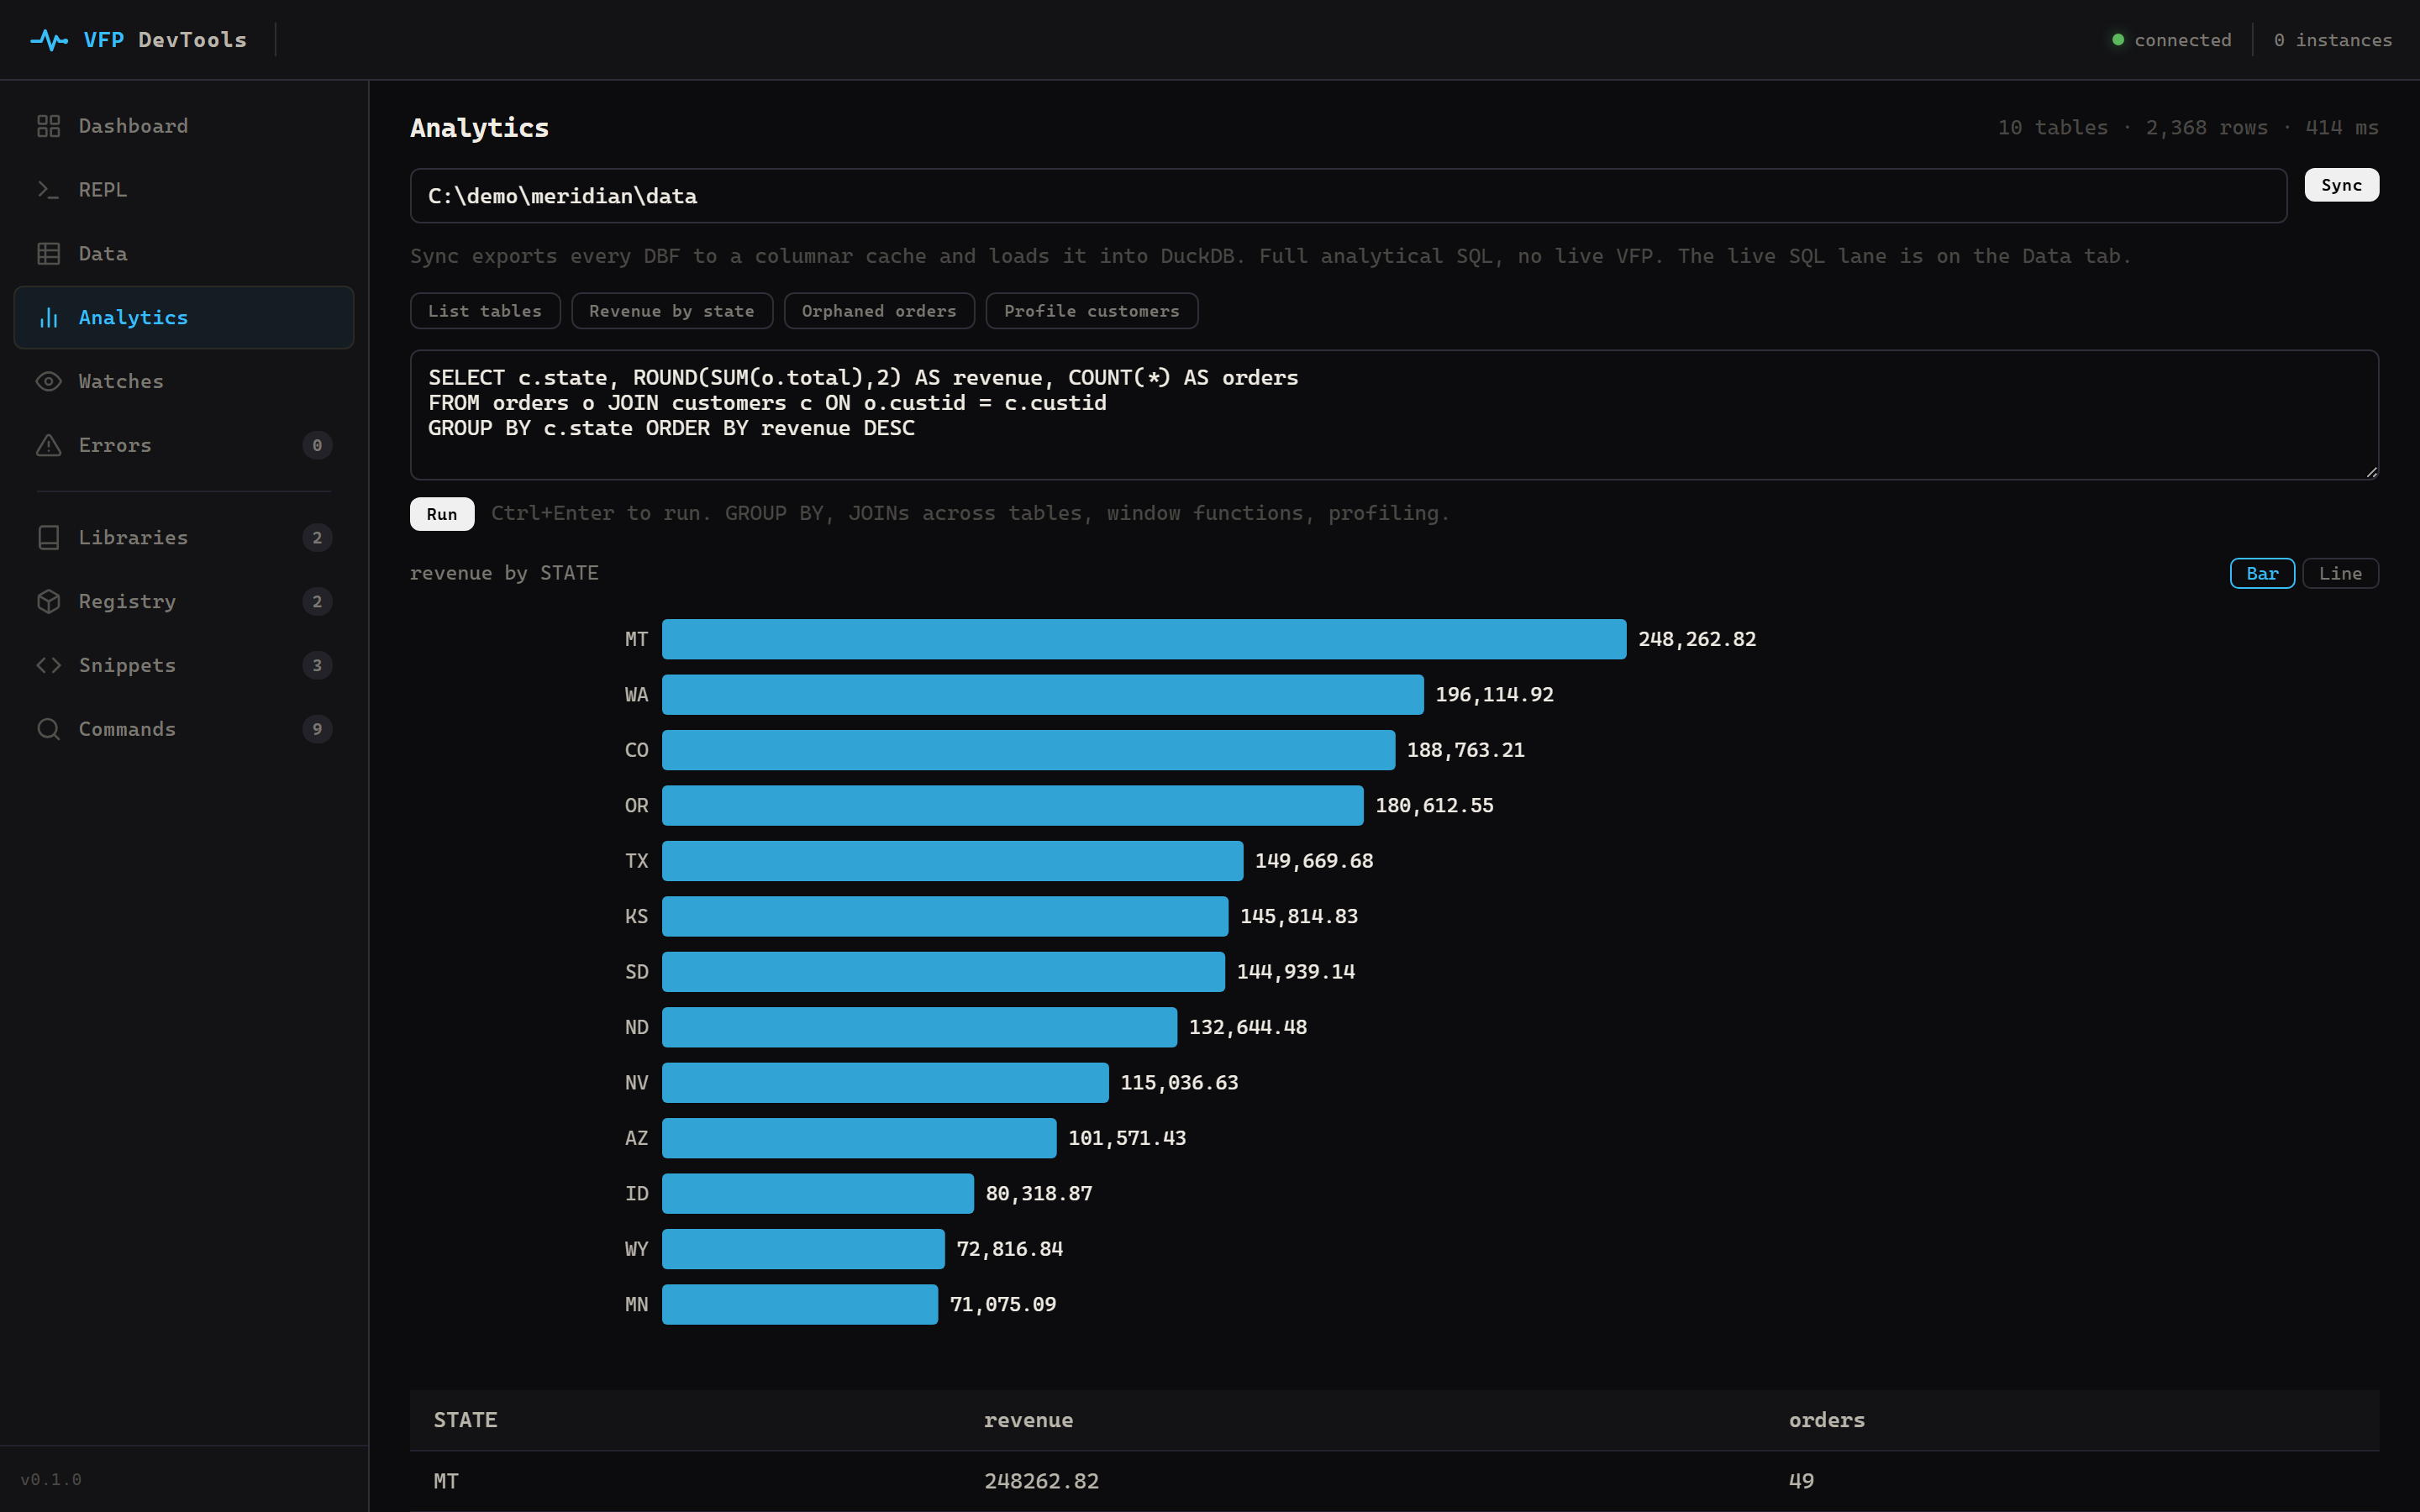
Ask hard questions of your data.
Sync your tables to a fast columnar cache and run full analytical SQL over them, with no VFP running, GROUP BY, JOINs across every table, window functions, data profiling, the queries FoxPro's own engine makes painful. Answers come back as a native chart or a grid. The reporting view your data never had.
Why DevTools
The developer tooling Visual FoxPro never had.
VFP has had no modern tooling since 2007. DevTools gives a running FoxPro app a live console, hot-reload for code and plugins, data and state you can inspect, and errors folded into issues, the things developers everywhere take for granted.
Live by design
A static map tells you what the code is. DevTools shows you what it does, while it runs, the half of the picture you can only see live.
Zero app-code changes
DevTools launches or attaches to VFP and wires in the tooling itself. Your application source stays exactly as it is, nothing to add, nothing to remember to remove.
Built for plugin development
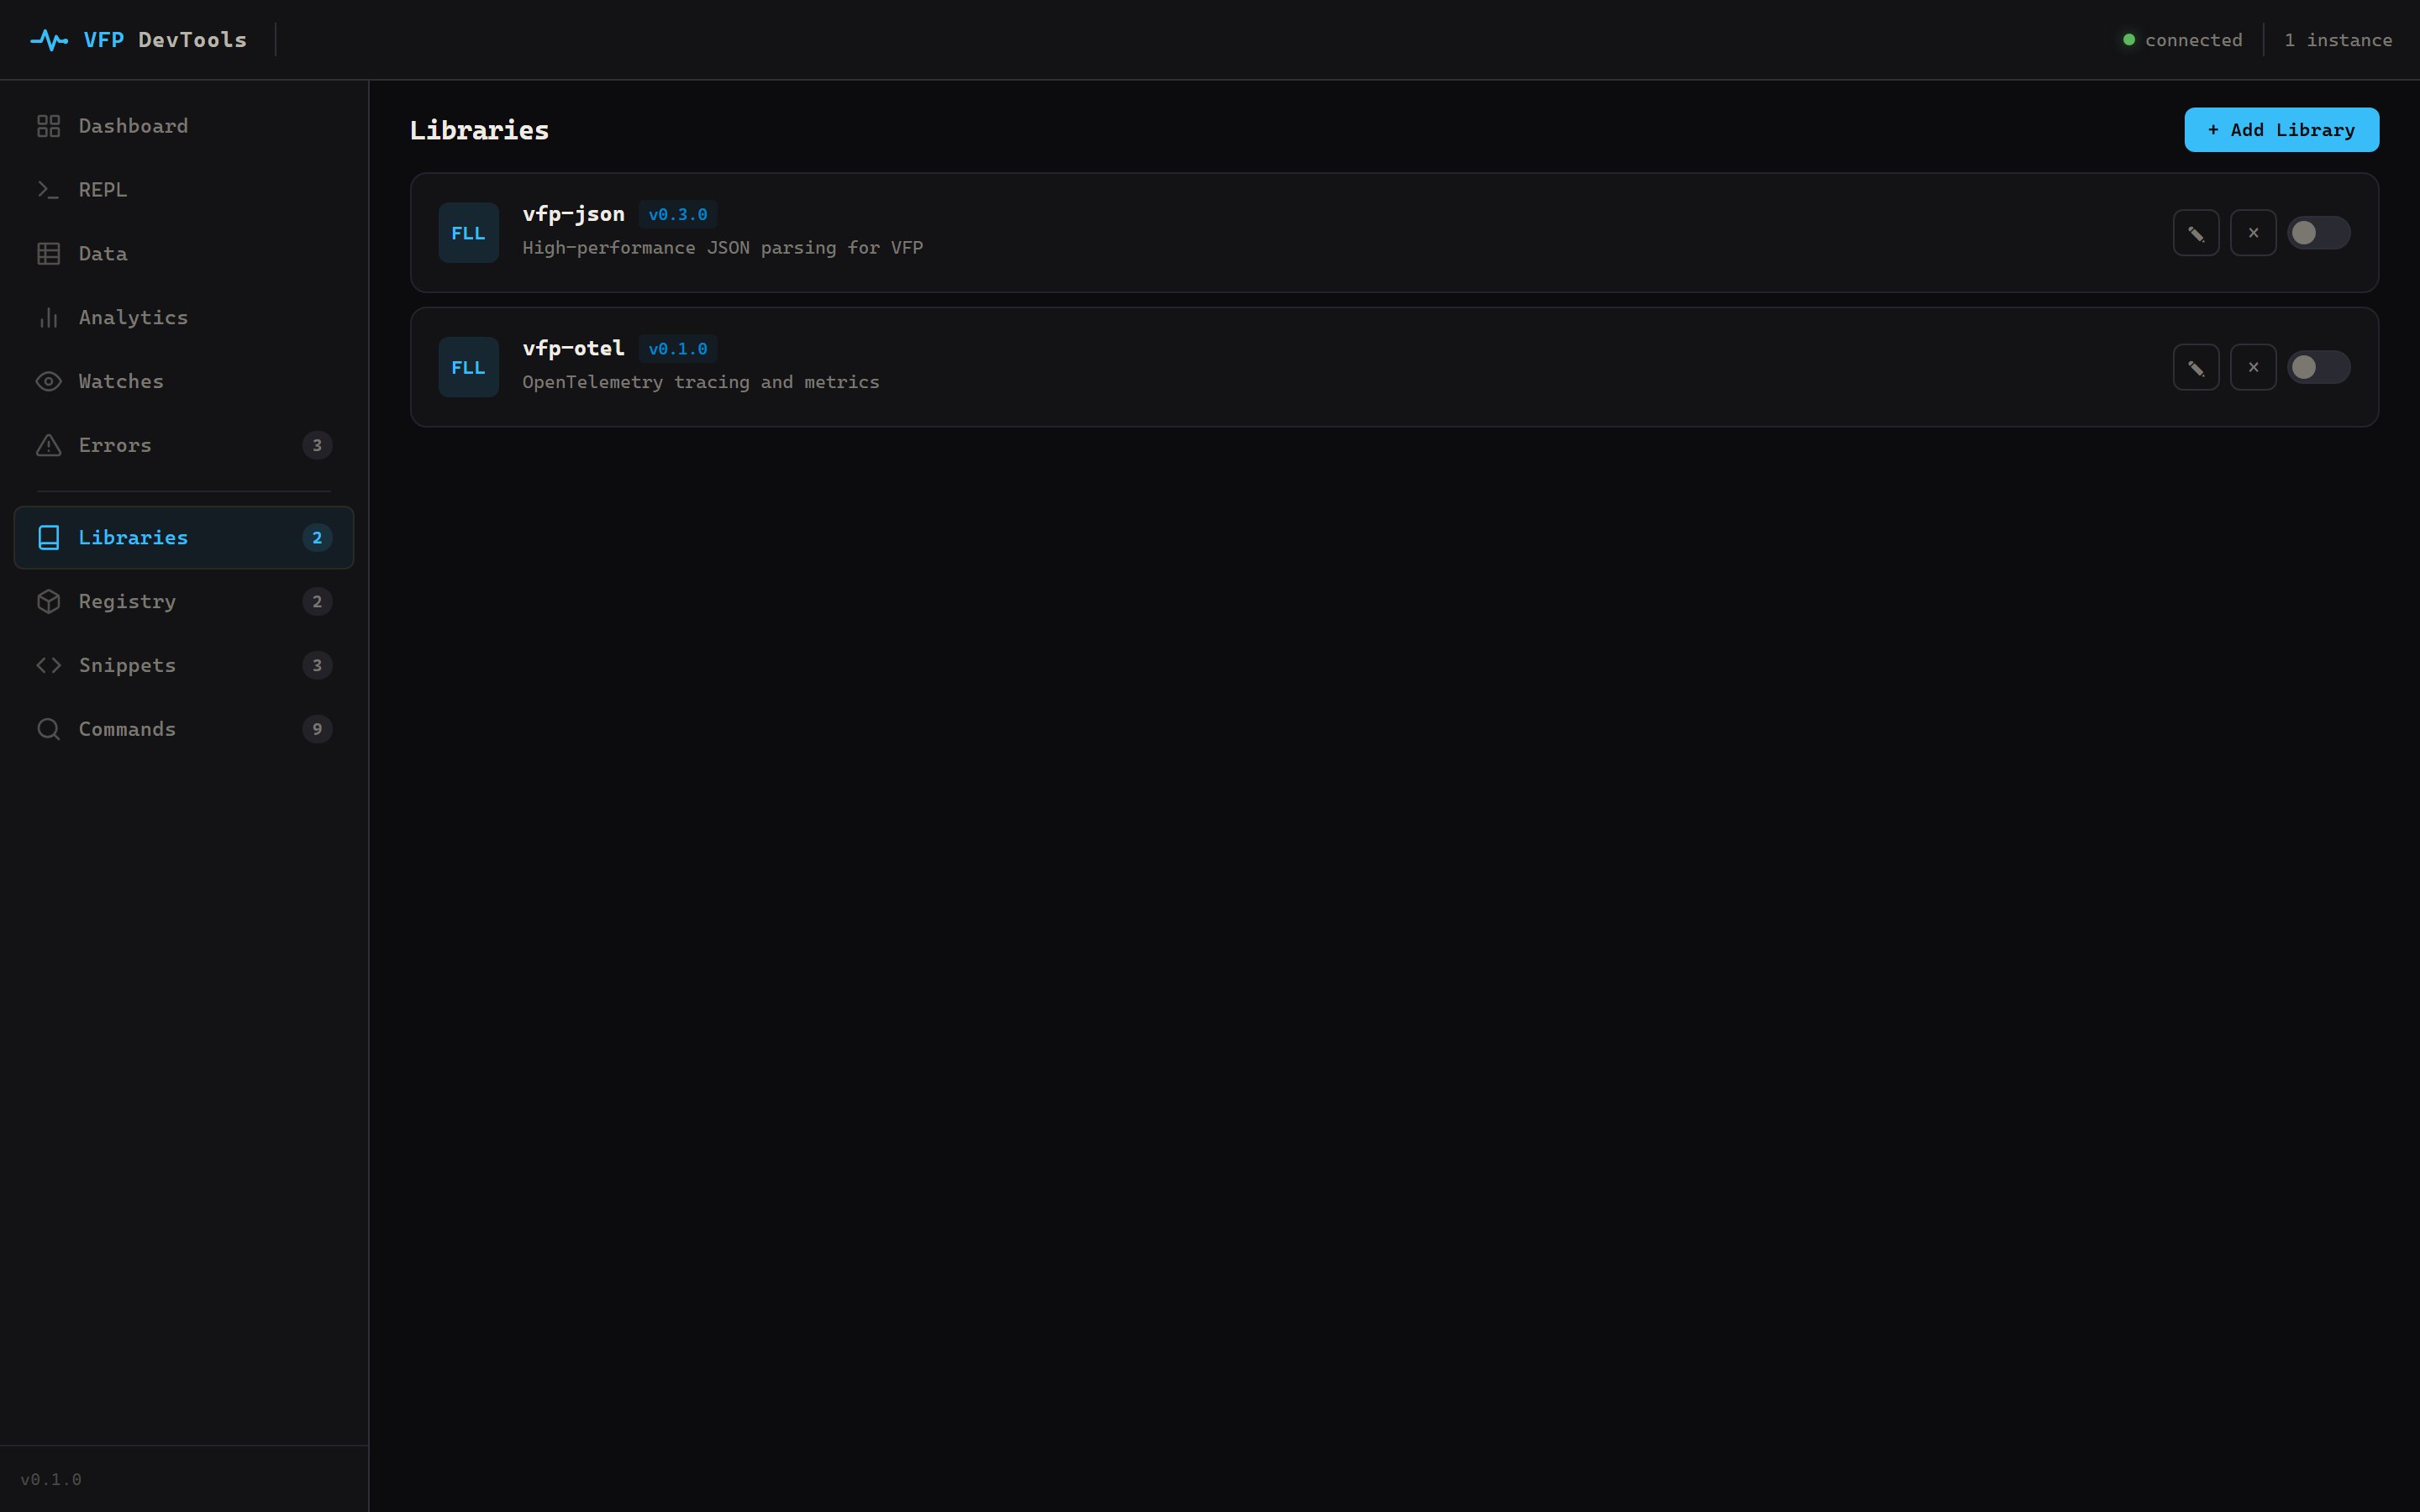
Rebuild an FLL or COM DLL and it hot-swaps into the running VFP, no restart. Install plugins from a registry, toggle libraries live, and register commands. The workbench FoxPro plugin development never had.
Insights into your running code
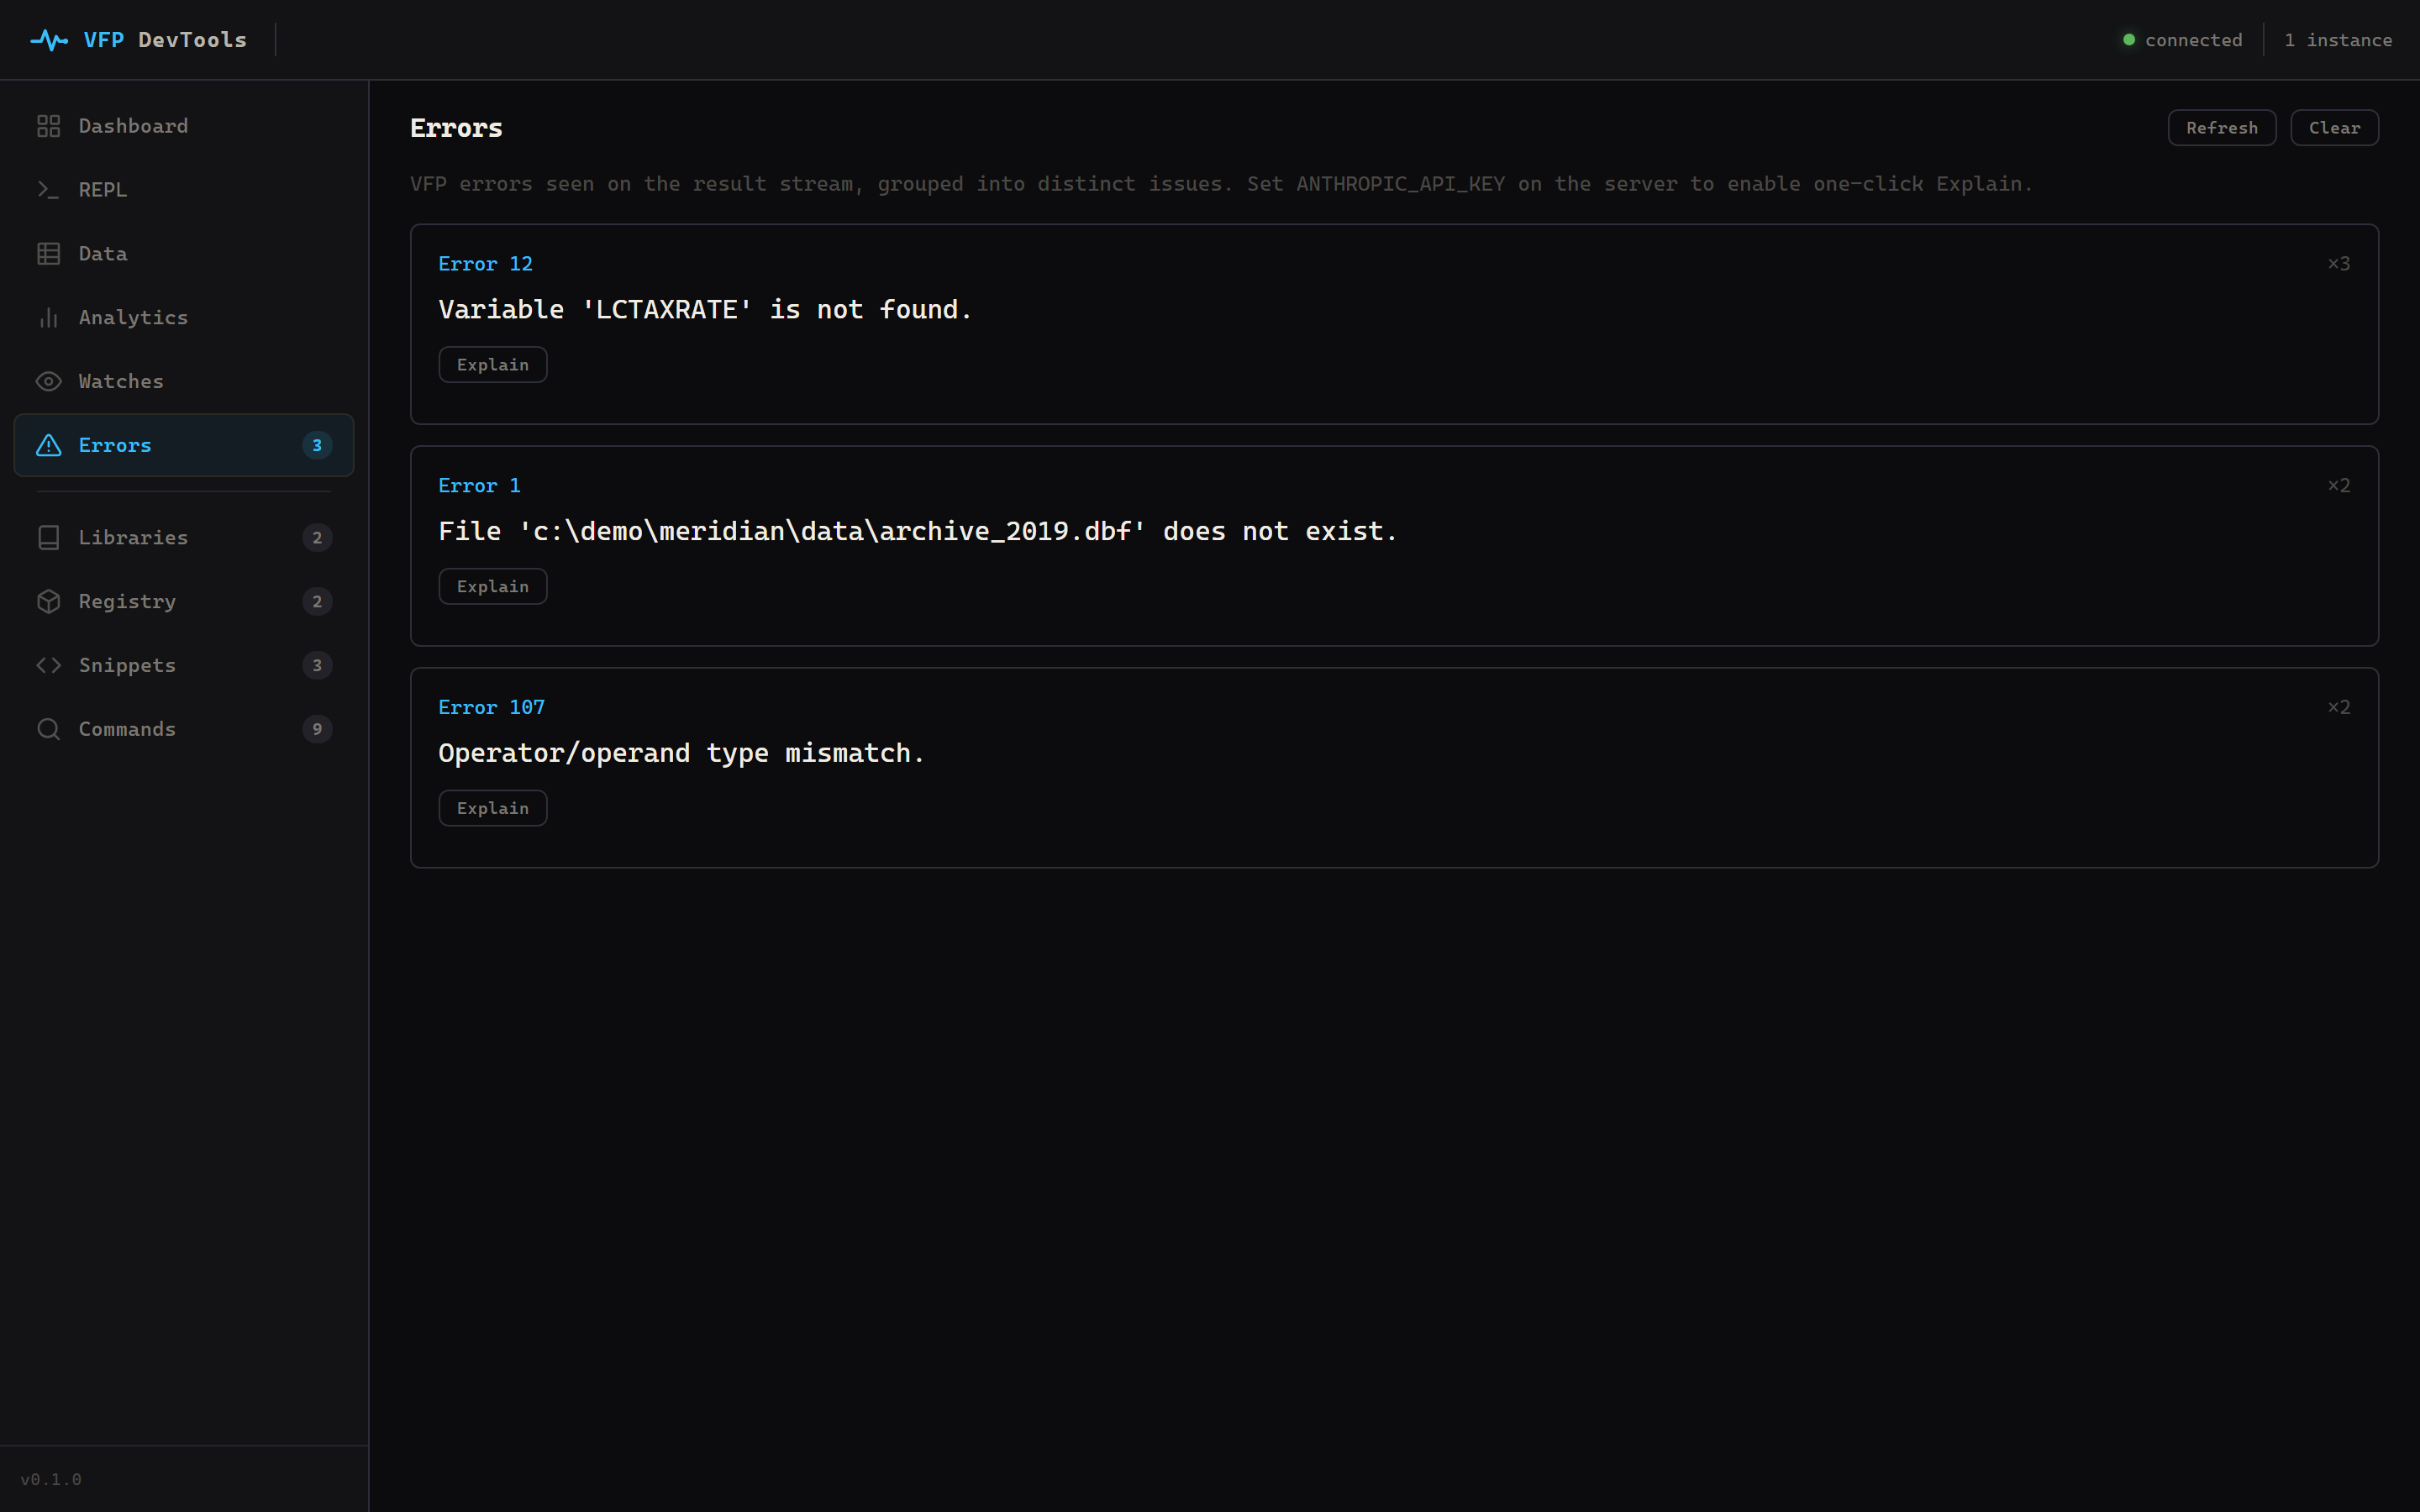
Query the live app, browse its tables, watch expressions and record counts update, and see errors folded into distinct issues, pointed at Visual FoxPro for the first time.
Companion product
Ship the same picture to production with vfp-beacon.
DevTools drives your app on your own machine. vfp-beacon is its production counterpart: a small, telemetry-only agent you build into your app that reports the same vitals, traces, grouped errors, and slow queries to a stack you host. It is one-directional and scrubbed of your data, and it carries none of the developer control plane. No console, no hot-reload, nothing that can reach in and change the app. Just the picture of your software running in the field.
ships inside your build · telemetry-only and one-directional · a dedicated vfp-beacon page is on the way
At a glance
Built for the way FoxPro is actually run.
changes to your app. DevTools attaches the tooling itself.
to launch VFP with the console, hot-reload, and dashboards attached.
live views: query and browse data, watch state, grouped errors, and call maps.
see it as it happens, not a log file read back hours later.
Get DevTools
DevTools is in private early access.
One edition, everything included. Tell us about your app and we'll set you up.
Everything DevTools does
The whole live workbench: build and hot-reload plugins, drive the app from a console, and inspect its data, state, and errors as it runs.
- One-click launch, start VFP with the tooling attached, no app changes
- Browser dashboard, connected instances and a live event log
- Live FoxPro console, run code against the running app
- Hot-reload, classes, programs, and compiled FLLs / COM DLLs reload without a restart
- Plugin registry, install and toggle FLL libraries live from the browser
- Feature toggles & saved snippets, flip and run against the live app
- Query the live app, run SQL against the running data and get rows back
- Table browser, read any VFP table in the browser with no VFP running
- Analytics, sync your tables and run analytical SQL with native charts, no VFP running
- Watch expressions, a live inspector for record counts, cursors, and variables
- Live call maps, which routines run, how often, and who calls whom
- Runtime vitals, memory, cursors, forms, event-loop heartbeat
- Grouped errors with one-click explain, thousands folded into a handful of issues
- Slow-query insight, queries flagged when the optimizer missed them
- vfp-beacon, the production companion: a safe, telemetry-only agent for the field
- Priority support from the team that builds it
FAQ
Fair questions, straight answers.
Do I have to change my application?
No. DevTools launches or attaches to Visual FoxPro and wires in the tooling itself, your source stays exactly as it is. There's nothing to add to your app and nothing to remember to strip out before you ship.
Is it safe to run in production?
The developer workbench runs on your machine, not in production. For the field you ship vfp-beacon, a separate telemetry-only, one-directional agent: it reports vitals, traces, and errors and never sends commands into the app. It is scrubbed of your data: names, counts, and timings leave the box, never field values or records.
What do I need to run it?
Windows with Visual FoxPro 9 for the live workbench features. The dashboards run in any browser, and the observability views run on a lightweight open-source stack you host yourself.
Does my code or data leave my machine?
The developer tooling runs entirely local. The optional production companion, vfp-beacon, sends only scrubbed metrics, traces, and logs to a stack you control: names, counts, and timings, never the contents of your tables.